AR Graphs
Studying Edge Styles in 3D Node-Link Diagrams
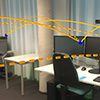
Networks are a particularly important type of data for immersive visualizations, as they are used to show relations between real and virtual objects. Examples of such relations are computer networks, information flows in a smart home, and connections between situated visualizations. However, there was little research on how to design immersive AR node-link visualizations. Thus, in this project, we investigated how to design edge visualizations in 3D node-link diagrams. To this end, we conducted two studies in which we examined which visual variables are most suitable and how different edge styles perform compared to each other.

For more details about this project, please take a look at the main project website! Additionally, if you would like to cite this work in your research, please cite our CG&A article.
References
2019
-
 IEEE Computer Graphics and Applications, Feb 2019

2018
-
 Investigating Link Attributes of Graph Visualizations in Mobile Augmented RealityIn CHI 2018 Workshop on Data Visualization on Mobile Devices, Apr 2018
